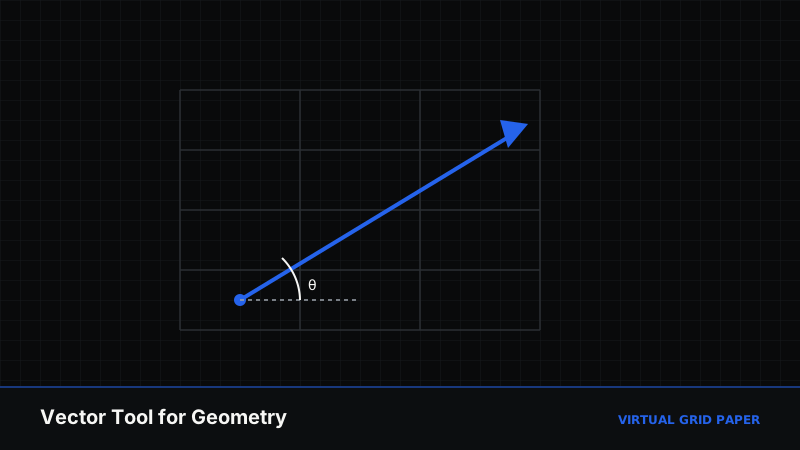
A vector is more than a line — it has a direction and a magnitude. The vector tool on Virtual Grid Paper draws a directed arrow and tells you both values live, which makes it the right tool for physics forces, coordinate translations, and any geometry where direction matters.
This guide explains how the drawing canvas vector tool works, how it differs from a plain segment, and how to use it to build clear physics and geometry diagrams.
Key Takeaways
- The vector tool draws a directed arrow with a head and tail.
- Live readouts show magnitude and angle as you draw.
- Snap-to-grid places the tail and head on exact coordinates.
- Combine vectors to show addition, resultants, and force systems.
Table of Contents
- Vectors vs. Segments
- Drawing a Vector Step by Step
- Reading Magnitude and Direction
- Physics and Geometry Applications
- Combining Vectors
- Common Mistakes
- Frequently Asked Questions
1. Vectors vs. Segments
Both a segment and a vector connect two points, but they mean different things:
| Segment | Vector | |
|---|---|---|
| Direction | None | Directed (tail → head) |
| Appearance | Plain line | Arrow |
| Reports | Length | Magnitude and angle |
| Typical use | Edges of shapes | Forces, translations, displacements |
If you only need the edge of a polygon, use the segment tool (covered in drawing rectangles and polygons). When direction carries meaning — a push, a velocity, a shift in position — use the vector tool.
2. Drawing a Vector Step by Step
- Open the drawing canvas and select the Vector tool.
- Keep snap-to-grid on so the tail lands on an exact point.
- Click to place the tail (start point).
- Drag to the head (end point); an arrow grows and readouts update.
- Release when the magnitude and angle match your target.
The arrowhead always marks the direction, so a viewer can immediately read which way the vector points.
3. Reading Magnitude and Direction
As you drag, the canvas shows the vector’s magnitude (its length) and angle (its direction relative to the horizontal). This lets you construct a vector to spec — for example a force of 5 units at 30° — by dragging until both readouts are correct.
The angle is measured counter-clockwise from the positive x-axis, following the standard mathematical convention: 0° points right, 90° points straight up, 180° points left. Knowing this convention lets you set a vector precisely — a velocity “up and to the right at 45°” is a drag until the readout reads 45°, not a guess.
Because the tail and head snap to grid intersections, you can also read a vector’s components straight off the numbered axes: a vector from (0, 0) to (3, 4) has horizontal component 3 and vertical component 4. The magnitude readout confirms the length as √(3² + 4²) = 5, and the angle reads roughly 53.13° — the classic 3-4-5 right triangle made visible. This is the fastest way to check that a drawn vector matches the numbers in a problem.
Draw a vector now
Open the drawing canvas →4. Physics and Geometry Applications
The vector tool shines in diagrams where direction and size both matter:
- Force diagrams — represent each force as an arrow scaled to its magnitude.
- Velocity and displacement — show motion over the coordinate plane.
- Translations — illustrate how a shape moves by a fixed vector.
- Coordinate geometry — read components directly from the axes.
Because the readouts are live, students can experiment with how changing an angle or length changes a vector, turning the canvas into an interactive learning surface. For classroom uses, see virtual graph paper for students.
5. Combining Vectors
Draw several vectors on one canvas to demonstrate vector operations:
- Addition — place the tail of the second vector at the head of the first; the arrow from the original tail to the final head is the resultant.
- Resultant forces — combine two force vectors to show the net effect.
- Component breakdown — draw horizontal and vertical vectors that sum to a diagonal one.
Snap-to-grid keeps every start and end point exact, so the geometry of the addition stays true.
Worked example: adding two forces
Say two forces act on a point: 3 units east and 4 units north. To find the resultant on the grid:
- Draw the first vector from (0, 0) to (3, 0) — the magnitude readout confirms 3 units at 0°.
- Starting from its head at (3, 0), draw the second vector up to (3, 4) — 4 units at 90°.
- Draw a third vector from the original tail (0, 0) straight to the final head (3, 4). This is the resultant: the readout shows a magnitude of 5 units at about 53°.
The grid turns the parallelogram rule into something you can see and measure rather than only calculate. Reverse the order — draw the north force first, then the east force tip-to-tail — and you land on the same point, a tidy demonstration that vector addition is commutative.
6. Common Mistakes
- Using a segment when direction matters — the vector tool’s arrow and angle readout are there for a reason.
- Ignoring the readouts when a vector needs an exact magnitude or angle.
- Turning snapping off, which makes component reading imprecise.
- Overcrowding a diagram — label vectors with the text tool to keep it readable.
When to Use the Vector Tool
Use it for physics diagrams, coordinate translations, and any figure where an arrow’s direction is meaningful. For undirected edges and outlines, the segment and polygon tools are more appropriate.
Related Tools and Guides
- Online geometry drawing tools
- Coordinate geometry on graph paper
- How to use the drawing canvas
- Open the drawing canvas
Conclusion
The vector tool turns the grid into a workspace for directed quantities. With live magnitude and angle readouts, snap-to-grid precision, and the ability to combine arrows into resultants, it makes physics and geometry diagrams both accurate and easy to build. Whenever direction is part of the story, reach for the vector tool.
Frequently Asked Questions
What does the vector tool draw?
It draws a directed arrow from a start point to an end point, showing both its magnitude (length) and direction (angle). This makes it suited to physics forces, translations, and coordinate geometry.
Can I read a vector’s magnitude and angle?
Yes. As you drag the vector, the canvas displays live magnitude and angle readouts, so you can set a vector to an exact length and direction without separate calculation.
How is the vector tool different from the segment tool?
A segment is an undirected line between two points, while a vector is directed — it has a head and a tail — and reports magnitude and direction. Use vectors when direction matters, such as forces.
Can I combine several vectors in one diagram?
Yes. Draw multiple vectors on the same canvas to illustrate addition, resultants, and force systems. Snap-to-grid keeps their start and end points on exact coordinates.