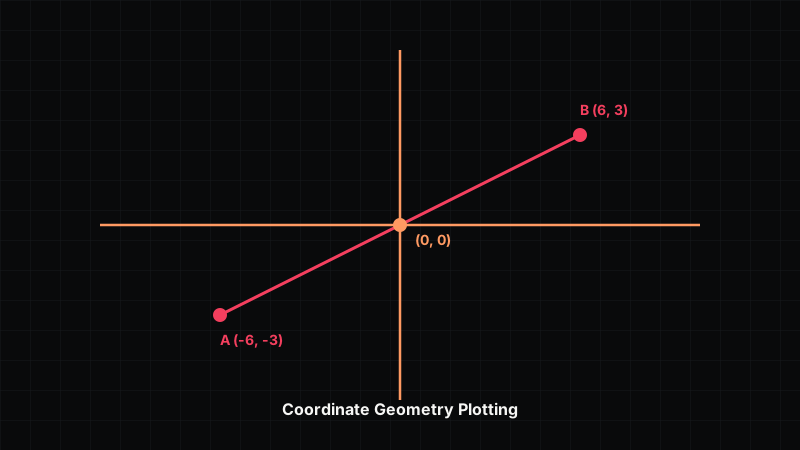
Coordinate geometry—also known as analytic geometry—bridges algebra and geometry by using numerical ordered pairs (x, y) and algebraic equations to describe geometric figures on a two-dimensional plane.
Central to this mathematical discipline is graph paper. By establishing a Cartesian coordinate system over intersecting grid lines, graph paper provides a visual environment where abstract equations transform into geometric lines, circles, and polygons.
Key Takeaways & Quick Overview
- Cartesian Grid Plane: Composed of perpendicular X-axis (horizontal) and Y-axis (vertical) intersecting at the origin (0, 0).
- 4 Quadrants: Quadrant I (+,+), Quadrant II (-,+), Quadrant III (-,-), and Quadrant IV (+,-).
- Core Formulas:
- Slope (m):
m = Δy / Δx = (y₂ - y₁) / (x₂ - x₁)- Distance (d):
d = √((x₂ - x₁)² + (y₂ - y₁)²)- Midpoint (M):
M = ((x₁ + x₂)/2, (y₁ + y₂)/2)- Interactive Plotting: Web tools automatically lock points to integer grid intersections and display live slope and distance readouts.
Table of Contents
- Setting Up the Cartesian Coordinate System on Graph Paper
- Step-by-Step Point Plotting on a Grid
- Calculating Line Slope (m), Distance (d), and Midpoints (M)
- Plotting Geometric Polygons and Transformations
- Interactive Coordinate Geometry Online
- Frequently Asked Questions
1. Setting Up the Cartesian Coordinate System on Graph Paper
To convert a blank page of graph paper into a coordinate plane:
Cartesian Plane Quadrants on Graph Paper:
               Y-Axis
                 ^
  Quadrant II    |    Quadrant I
   ( - , + )     |     ( + , + )
                 |
<----------------+----------------> X-Axis (Origin 0,0)
                 |
  Quadrant III   |    Quadrant IV
   ( - , - )     |     ( + , - )
v- Draw the Axes: Draw a heavy horizontal line across the middle of the page (X-axis) and a heavy vertical line (Y-axis) intersecting at right angles.
- Mark the Origin (0, 0): Label the intersection point as the origin.
- Assign Scale Intervals: Label integer tick marks along the grid lines (1, 2, 3… to the right/up, and -1, -2, -3… to the left/down).
Understanding the Four Quadrants:
- Quadrant I (Top-Right): Both coordinates are positive (+x, +y).
- Quadrant II (Top-Left): X is negative, Y is positive (-x, +y).
- Quadrant III (Bottom-Left): Both coordinates are negative (-x, -y).
- Quadrant IV (Bottom-Right): X is positive, Y is negative (+x, -y).
2. Step-by-Step Point Plotting on a Grid
An ordered pair (x, y) defines an exact position:
- x-coordinate (Abscissa): Dictates horizontal movement from the origin (right if positive, left if negative).
- y-coordinate (Ordinate): Dictates vertical movement from the origin (up if positive, down if negative).
Plotting Point P( -4, 3 ):
1. Start at Origin ( 0, 0 )
2. Move 4 units LEFT along the X-axis to x = -4
3. Move 3 units UP parallel to the Y-axis to y = 3
4. Mark point P at grid intersection ( -4, 3 )
3. Calculating Line Slope (m), Distance (d), and Midpoints (M)
Once points are plotted on graph paper, coordinate geometry formulas allow you to derive geometric properties algebraically:
Slope & Distance Formula Reference:
Slope (m):      m = ( y2 - y1 ) / ( x2 - x1 )  =  Rise / Run
Distance (d):   d = sqrt( ( x2 - x1 )² + ( y2 - y1 )² )
Midpoint (M):   M = ( ( x1 + x2 ) / 2 , ( y1 + y2 ) / 2 )
A. Calculating Slope (m)
Slope measures the steepness of a line segment connecting (x₁, y₁) and (x₂, y₂). On graph paper, slope can be verified visually by counting grid squares:
m = Rise / Run = (y₂ - y₁) / (x₂ - x₁)
- Positive Slope (m > 0): Line slants upward from left to right.
- Negative Slope (m < 0): Line slants downward from left to right.
- Zero Slope (m = 0): Line is perfectly horizontal.
- Undefined Slope: Line is perfectly vertical (Δx = 0).
B. Applying the Distance Formula (d)
The distance between two points is derived from the Pythagorean theorem on graph paper:
d = √((x₂ - x₁)² + (y₂ - y₁)²)
To learn how to construct right triangles to verify distance visually, read our guide on drawing geometric shapes on graph paper.
Interactive Geometry
Want to plot coordinates directly on an interactive plane?
Drop points, calculate slopes, and draw polygons with real-time HUD feedback in Virtual Grid Paper.
4. Plotting Geometric Polygons and Transformations
By plotting multiple coordinate vertices and connecting them with line segments, you can construct polygons and execute geometric transformations:
Constructing Rectangle ABCD:
Point A: ( -3, -2 )    Point B: ( 5, -2 )
Point C: ( 5, 4 )      Point D: ( -3, 4 )
Calculated Width:  | 5 - (-3) | = 8 units
Calculated Height: | 4 - (-2) | = 6 units
Calculated Area:   8 * 6 = 48 square units
Geometric Transformations on Graph Paper:
- Translation (Slide): Add or subtract constants: (x + a, y + b).
- Reflection (Flip): Reflecting across the X-axis negates Y: (x, -y). Reflecting across the Y-axis negates X: (-x, y).
- Rotation (Turn): Rotating 90° counter-clockwise around the origin maps (x, y) → (-y, x).
For a comparison of how coordinate graph paper differs from uniform grid paper, read our analysis of graph paper vs. grid paper.
5. Interactive Coordinate Geometry Online
While hand-drawing coordinate axes takes time, using an online graph paper workspace automates the setup:
- Automatic Axis Rendering: Toggle heavy Cartesian X/Y axes in one click.
- Point-to-Point Grid Snapping: Vertices lock to exact integer coordinates automatically.
- Real-Time Readouts: Displays line slope, segment length, and vector offsets dynamically as you draw.
Frequently Asked Questions
What is the Cartesian coordinate system on graph paper?
The Cartesian coordinate system consists of two perpendicular number lines—the horizontal X-axis and vertical Y-axis—intersecting at an origin point (0, 0) to define spatial locations using ordered pairs (x, y).
How do you label the four quadrants on coordinate graph paper?
The quadrants are numbered counter-clockwise starting from the top-right: Quadrant I (+,+), Quadrant II (-,+), Quadrant III (-,-), and Quadrant IV (+,-).
Can I plot coordinate geometry equations online?
Yes, web tools like Virtual Grid Paper allow you to plot points, construct line segments, calculate slope, and draw geometric figures on an interactive coordinate plane with automatic grid snapping.