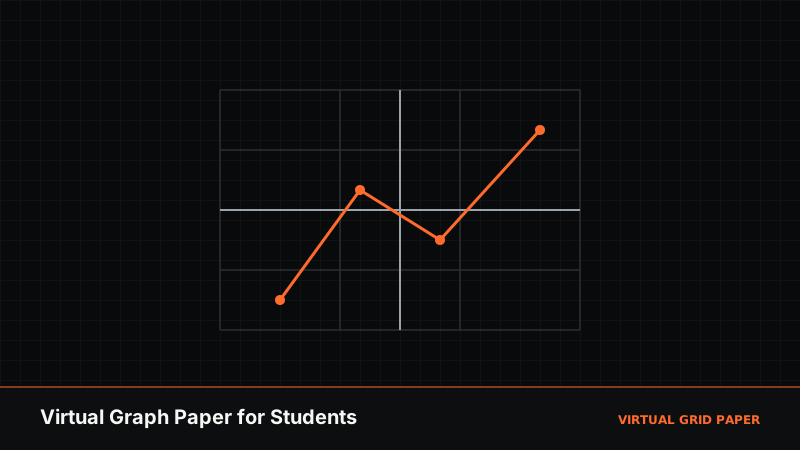
For students, graph paper turns up everywhere — plotting coordinates in math, sketching a circuit in science, ruling a neat table, or drawing a diagram. Virtual graph paper puts all of that on any device with a browser: a precise grid you can draw on, no printing required, and free to use. This guide shows students how to get real schoolwork done with it.
The main tool is the drawing canvas, backed by the printable graph paper generator when a physical sheet is needed. Both are free, with no account and no watermark.
Key Takeaways
- Plot coordinates precisely with numbered axes and snap-to-grid.
- Draw geometry, graphs, and science diagrams with built-in shape tools.
- Work auto-saves in your browser; export PNG, SVG, PDF, or JSON to submit or back up.
- Free, no signup, no watermark — print a sheet when you need paper.
Table of Contents
- Why Virtual Graph Paper Suits Students
- Math: Coordinates and Graphs
- Geometry and Science Diagrams
- Submitting and Saving Your Work
- Common Mistakes
- Frequently Asked Questions
1. Why Virtual Graph Paper Suits Students
Physical graph paper runs out, gets crumpled, and never seems to be the right type when you need it. Virtual graph paper does not:
- Always available — open the drawing canvas on a laptop, tablet, or phone; no trip to buy a pad.
- Precise — snap-to-grid and numbered axes make coordinates and shapes exact, which is hard to do freehand.
- Editable — move, undo, and redo instead of erasing through the page.
- Free and private to your device — no signup, no watermark, and your work auto-saves locally in your browser rather than being sent to a server.
For a general tour of the canvas beyond the student context, see how to use online graph paper.
2. Math: Coordinates and Graphs
Coordinate work is where virtual graph paper shines. The canvas gives you numbered axes, so you can read positions directly, and snap-to-grid, so every point lands exactly on a lattice point.
To plot and graph:
- Use the point tool to place coordinates — snap-to-grid drops each one precisely on its intersection.
- Connect points with the line or segment tools to draw a graph or a shape between coordinates.
- Read the live length and angle feedback as you draw, useful for checking gradients and distances.
- Label points or axes with the text tool.
This is ideal for plotting functions, marking coordinate pairs, drawing linear graphs, and checking transformations. The deeper technique is in coordinate geometry on graph paper.
3. Geometry and Science Diagrams
Beyond plotting, the canvas carries a full set of drawing tools that cover most school diagrams:
- Geometry — the circle, arc, rectangle, polygon, and vector tools draw accurate shapes, with angle and length readouts to keep constructions exact. See how to draw geometric shapes on graph paper.
- Science — the grid keeps circuit diagrams, ray diagrams, and force vectors tidy and to scale; the vector tool is handy for physics.
- Neat layouts — rule quick tables or timelines against the grid without a ruler.
Because shapes are objects you can select and move, you can build a diagram up, adjust it, and fix mistakes without starting over — a real advantage over pen on paper.
Start plotting and drawing
Open the drawing canvas →4. Submitting and Saving Your Work
When an assignment is done, you can hand it in whichever way your class expects:
- Export PDF for a clean document to upload or print.
- Export PNG to drop into a slide, doc, or online submission.
- Export SVG if you need a scalable vector for a report.
- Save JSON to keep an editable copy you can reopen and continue later.
The canvas auto-saves in your browser, so your work is waiting when you return on the same device. That is convenient, not a backup — if you switch computers or clear your browser data it will not follow you, so export a PDF or save the JSON for anything important. The full detail is in saving and recovering your drawing.
If a class needs paper, print a matching sheet from the printable graph paper generator at 100% scale, as explained in printing graph paper at actual size.
5. Common Mistakes
- Relying only on auto-save — export a PDF or JSON so a cleared browser cannot lose your work.
- Drawing with snap-to-grid off when you need exact coordinates; keep it on for precision.
- Printing without 100% scale, which throws off measured work — turn off “fit to page”.
- Flattening to PNG when you may need to keep editing; save the JSON project too.
When Virtual Graph Paper Helps Most
It is most useful for precise, submittable schoolwork — coordinate graphs, geometry constructions, and tidy diagrams — and for anyone who does homework on a laptop or tablet. For quick handwritten practice, a printed sheet is still fine; generate one in seconds. Setting up a study space around these tools is covered in student study setup at home.
Related Tools and Guides
- How to use online graph paper
- Coordinate geometry on graph paper
- How to draw geometric shapes on graph paper
- Student study setup at home
Conclusion
Virtual graph paper gives students a precise, always-available grid for math, science, and neat diagrams — plot coordinates with snap-to-grid, build editable shapes, and export a PDF or PNG to hand in. It is free, needs no account, and saves your work in the browser as you go. Keep a backup export for anything that counts, and you have a dependable grid for every subject.
Frequently Asked Questions
Is virtual graph paper free for students?
Yes. The drawing canvas and printable generator are free with no signup and no watermark, so students can plot, draw, and print as much graph paper as they need.
Can I plot coordinates on virtual graph paper?
Yes. The drawing canvas has numbered axes and snap-to-grid, so you can place points precisely on coordinates and connect them into lines, shapes, or graphs.
Can I hand in work made on virtual graph paper?
Yes. You can export your work as a PNG, SVG, or PDF to submit digitally, or print a sheet to hand in on paper. A JSON file lets you save and reopen the project to keep editing.
Will I lose my work if I close the tab?
The drawing canvas auto-saves your work in your browser, so it is there when you return on the same device. For safekeeping, export a PDF or save the JSON project file as a backup.