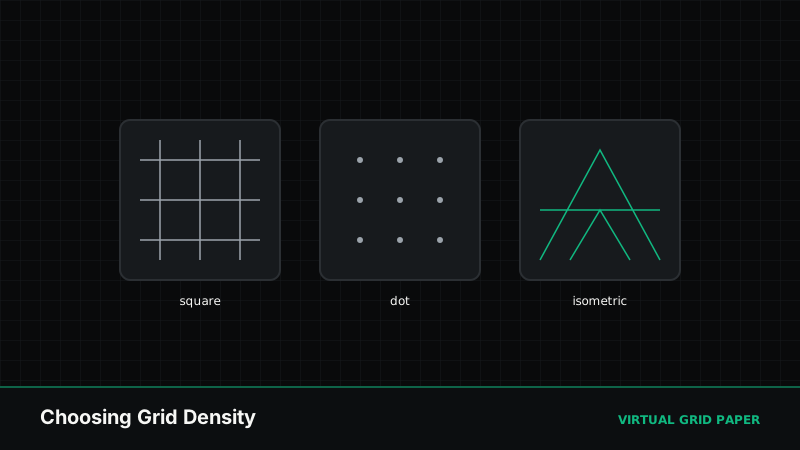
The style of graph paper gets most of the attention, but density — how big the cells are and how many fit on the page — quietly decides whether a sheet is a pleasure or a frustration to use. Too coarse and you cannot fit your work; too fine and you cannot write in the squares. This guide helps you match density to the task and set it exactly in the online generator.
If you are still deciding which grid style to use, start with square vs. dot vs. isometric graph paper; this article assumes you know the style and focuses on how tight the grid should be.
Key Takeaways
- Density is a trade-off: precision versus room to write.
- The best density is the coarsest that still meets your precision needs.
- The generator’s “Lines per page” (3–10) control sets density directly.
- Minor ticks add fine subdivisions without shrinking the main cells.
Table of Contents
- What Grid Density Really Means
- Density by Task
- Setting Density in the Generator
- Minor Ticks and Major Lines
- Common Mistakes
- Frequently Asked Questions
1. What Grid Density Really Means
Density is simply how much space each cell occupies — a 10 mm square is coarse, a 2 mm square is fine. Two things follow from it:
- Precision. Smaller cells let you place and read positions more exactly, which matters for detailed graphs and technical work.
- Writing room. Larger cells give you space to write a digit, a letter, or a symbol inside a square without it spilling over.
These pull in opposite directions, so choosing density is really choosing where to sit on that spectrum. The guiding rule is simple: pick the coarsest grid that still gives you the precision the task needs. Extra fineness you do not use only makes the page harder to read and to write on.
It helps to anchor the abstract idea to the cell sizes you will actually meet:
| Cell size | Equivalent | Feel | Typical use |
|---|---|---|---|
| 10 mm | ~0.4 in | Very coarse | Early handwriting, loose sketches |
| 5 mm | ~0.2 in | Medium (school standard) | Math, journaling, general notes |
| ¼ in | 6.35 mm | Medium | US classrooms, everyday graphing |
| 2 mm | ~0.08 in | Fine | Detailed plots, technical drawing |
| 1 mm | — | Very fine | Metric engineering, measuring off the page |
A 5 mm square fits a single handwritten digit comfortably; a 2 mm square does not, which is exactly why fine grids are for reading positions, not writing in them.
2. Density by Task
Different work sits at different points on the spectrum. As a starting guide:
| Task | Suggested density | Why |
|---|---|---|
| Early-years / large handwriting | Coarse (large cells) | Room to form big numbers and letters |
| General math & homework | Medium (5 mm / ¼ in) | One value per square, decent range |
| Detailed graphs & plotting | Fine | More points, finer reading |
| Engineering / metric precision | Fine (mm grid) | Measure directly off the page |
| Bullet journaling & notes | Medium (5 mm, often dots) | Guides layout without clutter |
| Sketching & thumbnails | Coarse–medium | Loose guidance, not precision |
These are starting points, not rules. A 5 mm cell is the international school standard precisely because it is a sensible middle ground for most people. For a broader treatment of the concept, see how to choose the right grid density.
3. Setting Density in the Generator
The printable graph paper generator makes density a single control:
- Lines per page runs from 3 (few, large cells) to 10 (many, compact cells). Lower numbers give big, widely spaced cells; higher numbers pack in a finer grid.
- The live preview updates as you drag it, so you can see how much room each square offers before printing.
A practical approach: set the lines-per-page low, print a test sheet, and only increase the density if you find you need more precision. It is easier to judge “too coarse” than to recover from a grid that is too fine to write on.
Set your grid density
Open the printable graph paper generator →4. Minor Ticks and Major Lines
You do not have to choose a single density and live with it. Two features let one sheet serve two levels of detail at once:
- Minor ticks add smaller subdivisions inside each main cell. This gives you a fine reference for precise work while keeping the main grid at a comfortable, readable size. Toggle them on when you need extra precision and off when you want a clean page.
- Major lines (bolder lines every few cells, available on the A4 graph paper generator) do the opposite: they group cells so you can count in fives or tens at a glance without slowing down.
Together, minor and major lines let a medium grid feel both spacious to write on and precise to measure with — often a better answer than simply making every cell smaller.
5. Common Mistakes
- Defaulting to the finest grid in the belief that more precision is always better; it usually just clutters the page.
- Ignoring handwriting size — a grid too fine for your writing forces you to spill across squares.
- Matching density to the wrong task, like a dense plotting grid for casual notes.
- Forgetting minor ticks, then over-densifying the whole sheet to get precision you only needed occasionally.
When Density Matters Most
Density matters most when you both write in the squares and measure along them — math, engineering, and scale drawing. For those, get it right or the sheet fights you. For loose sketching or rough notes, density is forgiving; almost anything moderate works. And whenever you will measure off the page, remember that scale accuracy also depends on printing at 100% — see printing graph paper at actual size.
Related Tools and Guides
- How to choose the right grid density
- Square vs. dot vs. isometric graph paper
- How to create printable graph paper online
- Standard graph paper size
Conclusion
Grid density is a balance between precision and writing room, and the right answer depends entirely on the task. Match the cell size to what you are doing, lean toward the coarsest grid that still works, and use minor ticks or major lines when you need two levels of detail on one sheet. In the generator, that is just the lines-per-page slider and a tick toggle away.
Frequently Asked Questions
What grid density is best for math?
For most math and coordinate plotting, a medium-to-fine density works well — a 5 mm or quarter-inch cell gives enough room to write a number in each square while still fitting a useful range on the page. Denser grids suit detailed graphs.
How do I set grid density in the online generator?
In the printable graph paper generator, use the ‘Lines per page’ control to set density from 3 (large cells) to 10 (compact cells), and toggle minor ticks to add finer subdivisions. The preview updates as you change it.
Is finer graph paper always better?
No. A denser grid gives more precision but is harder to write on and can look cluttered. The best density is the coarsest one that still gives you the precision your task needs.
What density suits bullet journaling?
A 5 mm cell, often as a dot grid rather than full lines, is the popular choice for journaling — fine enough to guide writing and layouts without the page looking busy.