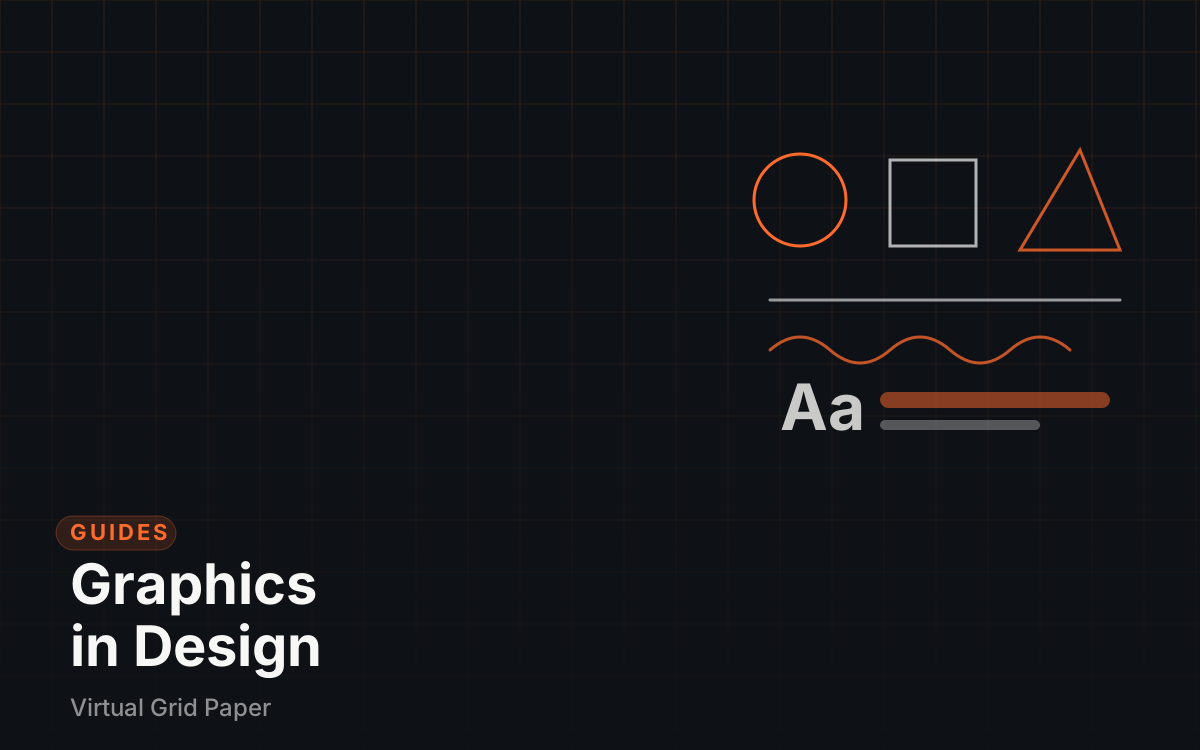
Graphics are the individual pieces a visual composition is assembled from: the photograph, the icon, the chart, the illustration, the dividing line. This guide separates the graphic from the design built around it, explains each element of visual language with a concrete example, sorts graphics by the role they play in a layout, and shows how those pieces combine in real compositions. It closes with a practical note on raster versus vector formats and the place of grids in keeping a composition coherent.
A graphic is one piece; graphic design is the assembly
A graphic is any single visual element: a photograph, an icon, an illustration, a chart, a decorative shape. Graphic design is the practice of arranging graphics, text, and space so the finished piece communicates — the graphic contributes, while the design decides where it sits, how large it is, and what surrounds it.
That division matters because no single element carries a whole piece by itself. A layout is an assembly, and the assembly decisions — grouping, scale, alignment, spacing — are what make the parts add up. Treating each part that way prevents the common trap of expecting one hero element to repair a design that has structural problems elsewhere.
The elements of design, each with a working example
Every layout is some combination of a small set of building blocks, usually listed as line, shape, form, texture, space, color, value, and typography.
Line, shape, and form
Line is the most direct element: it marks edges, separates content, and steers the eye. Painted wayfinding lines on a hospital or stadium floor guide whole crowds, thin rules under table headers guide reading, and arrows direct attention. Shape is closed territory: circles feel friendly and continuous, which is why avatars and round buttons use them; squares and rectangles feel stable and dependable, which suits form cards and packaging; triangles carry direction and movement, as play buttons and warning signs do. Form is shape given depth by light and shading — the sphere a circle becomes once value is added — and it is what makes product mockups and packaging renderings feel physical.
Texture and space
Texture is the surface quality of an element, real or implied. A grainy poster background, a kraft-paper label, or a brushed-metal panel adds tactility and warmth without introducing a new color. Space is the ground the elements sit in: positive space is occupied by content, and negative space is the emptiness left around it. Negative space is not waste — when groups of elements are held apart from other groups, the emptiness itself says these items belong together and those do not.
Color and value
Color carries association and mood faster than any other element, which is why organic and health brands reach for greens and food brands lean on warm tones. Value is light against dark, entirely separate from hue: converting a layout to grayscale reveals whether the composition still works and whether anything has become unreadable. Value contrast is also what keeps text legible over photographs, and it does more work than the specific color choice does.
Typography
Letterforms are graphics too. A high-contrast serif suggests heritage and fashion, a rounded sans feels casual and approachable, and a monospaced face signals code and technical precision — all before a single word is read. Typography functions like any other element: it is scaled, spaced, and placed to carry meaning, and it usually carries the most literal meaning available. Turning these building blocks into finished beginner work is covered in a beginner’s guide to visual design.
Types of graphics, and when each is the right choice
Graphics sort into roles by what they accomplish in a layout, and most projects use two or three roles rather than all of them.
| Type | Best at | Reach for it when |
|---|---|---|
| Photograph | Showing reality, texture, people, and mood with credibility | The subject gains from proof or emotional connection — products, places, portraits |
| Icon or symbol | Instant recognition at small sizes | Navigation, instructions, signage, floor plans |
| Illustration | Representing ideas and personality photographs cannot capture | Abstract concepts, brand character, stylized storytelling |
| Infographic or diagram | Explaining a process or structure step by step | The message is how something works or how its parts relate |
| Data chart | Showing quantity, change, and pattern | Numbers carry the argument |
| Decorative motif | Setting tone and unifying a piece | The piece needs cohesion across pages, and clarity is already handled |
One practical rule keeps the table honest: every graphic must earn its slot. An icon placed next to a heading clarifies it, while a second icon beside the first competes for the same attention. Photographs and diagrams also read as different kinds of information, so they are rarely interchangeable — a diagram teaches structure, and a photograph teaches appearance.
How elements combine into a finished composition
Focal point, grouping, repetition, and scale contrast are the main ways separate elements become a whole. The focal point is the single element that wins the first glance, grouping by proximity decides what belongs with what, repetition smooths everything into one system, and scale contrast stages the difference between the dominant and the supporting. Three worked examples show the mechanics:
An event poster. One large performer photograph becomes the focal point and gives the eye an entry, the event title rides large against it for scale contrast, and all the logistics — venue, date, ticketing — sit grouped in a single small block so nothing scatters. One repeated type treatment carries the title, the date, and the footer.
An app onboarding card. The icon or illustration holds a fixed upper slot, a short headline and one sentence sit close beneath it, and a single button anchors the bottom. Proximity ties the illustration to the headline, the empty space around the button protects the action, and the next card in the series repeats the same assembly so the flow feels designed rather than improvised.
A packaging side panel. The logo anchors the top margin, a diagram column explains use, and a row of small certification icons groups the claims at the base. Distinct areas of the panel keep those three jobs separate, and the palette repeats the front face so both sides read as one product.
Key Takeaway Fewer, larger, better-placed graphics beat a crowd of small ones, so pick the one element that carries the message and arrange everything else to support it.
Raster or vector: choose the format before designing
Two formats hold graphics, and the choice affects everything downstream. Raster graphics are grids of pixels — photographs and most screen exports — and they blur when scaled past their native size. Vector graphics are described mathematically as points and curves, so they scale to any size with crisp edges, which is why logos, icons, and line-based artwork are built in vector form. Raster vs vector graphics walks through the tradeoffs in detail, including the cases where a mix of the two is right.
Line-based work such as graph paper drawings sits naturally in vector territory, and the online drawing tool exports work as vector PDF or SVG — exporting an online graph paper drawing covers the formats and settings. That matters whenever a graphic needs to move into print or into larger-format use later.
Grids frame graphics, and restraint is the point
A layout grid assigns graphics to zones before styling decisions begin, which keeps margins even and stops a composition from drifting. It also limits decoration: when every slot already has a job, low-contrast ornament has nowhere to go. The grid generator sets columns, gutters, and margins over any canvas, and the photo grid maker composites several photographs into an evenly spaced single graphic when a piece needs multiple images at once.
Two companion reads extend the picture: what a graphic designer actually does situates these tasks inside the wider role, and the classic training method of placing a grid over a reference to study proportion and placement appears in grid drawing exercises that improve accuracy.
Common Mistake Treating a graphic as wallpaper. A pattern or an extra illustration placed behind text lowers contrast and makes both layers harder to read than either would be alone.
Curate a small set of pieces, then assemble carefully
Strong compositions are usually built from a small, deliberate set of graphics rather than a broad collection, so gather the few pieces a project actually needs and confirm each one’s role before styling anything. Assemble with grouping and alignment doing the connecting work, and let a single element hold the focal point. With the parts selected and the grid set, even a first composition reads as intentional.